Your CPA result
Benchmark read
Enter campaign values to estimate your acquisition cost.
Calculate your CPA to see how it compares with the planning band for your primary channel.
Built for paid media teams
Use this tool to benchmark your acquisition cost and see whether your campaigns are efficient enough to scale.
Use the tool below to work out acquisition cost from live campaign results or estimate it from CPC and conversion rate.
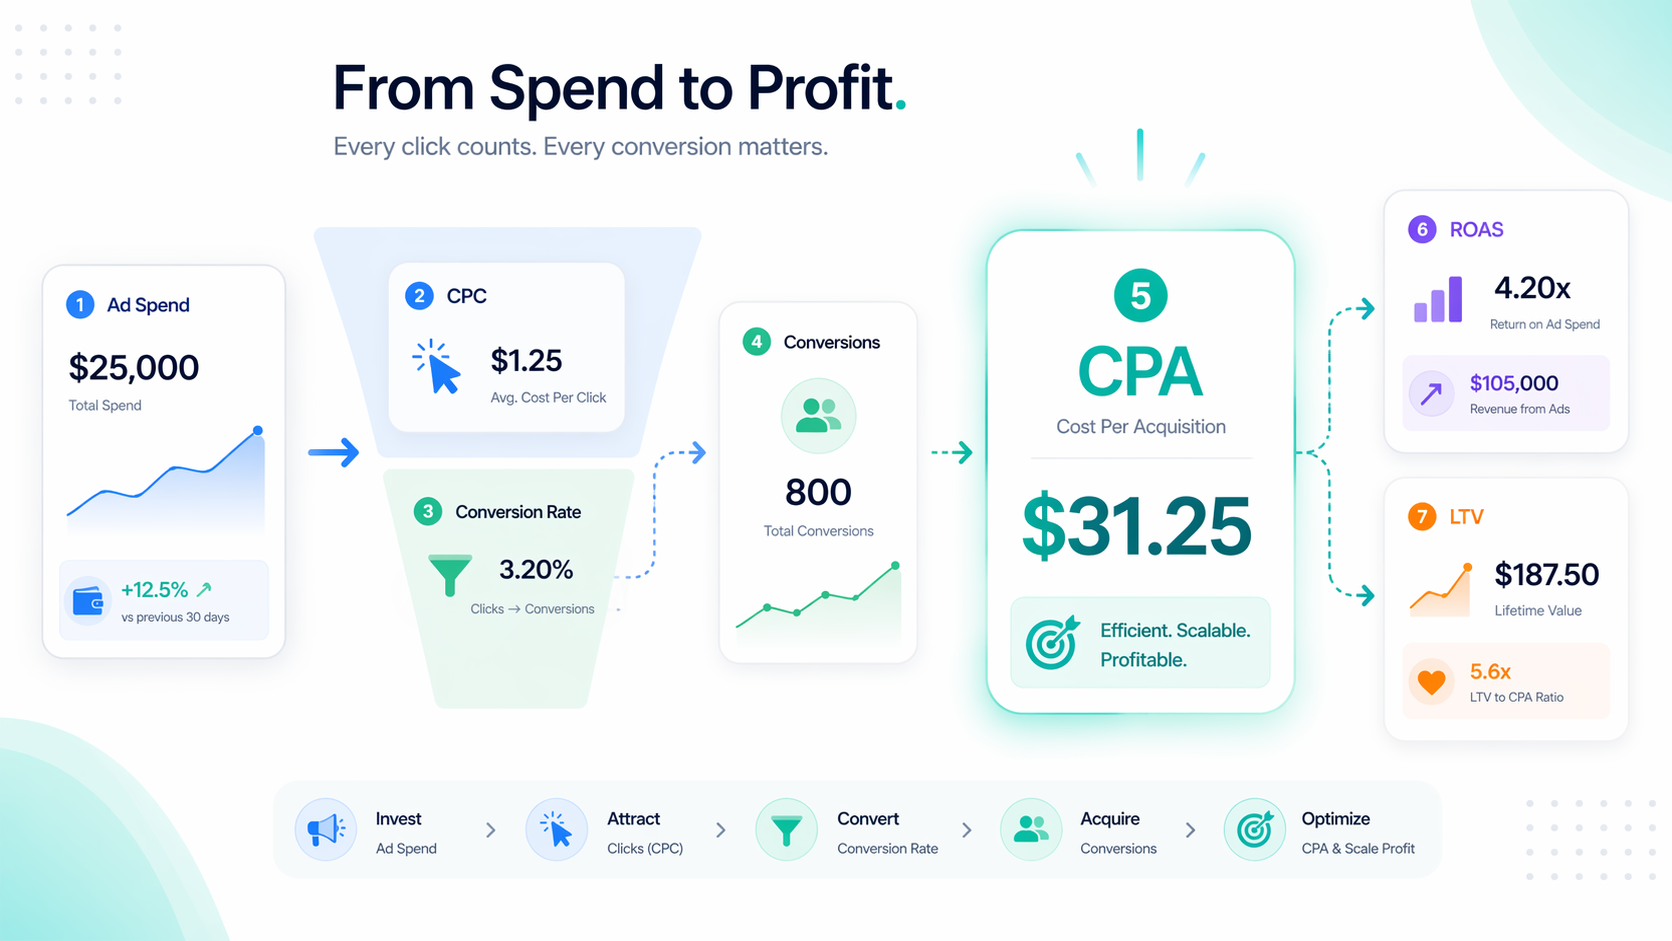
Formula
CPA = Ad Spend / ConversionsYour numbers stay in your browser. We do not store calculation inputs.
Your CPA result
Enter campaign values to estimate your acquisition cost.
Calculate your CPA to see how it compares with the planning band for your primary channel.
This number only works if your margin, payback period, and customer value support it.
If CPA is above target, review traffic cost, landing page conversion, and measurement quality before increasing budget.
This number only works if your margin, payback period, and customer value support it.
If CPA is above target, review traffic cost, landing page conversion, and measurement quality before increasing budget.
CPA measures how much you pay to generate one real outcome, such as a purchase, qualified lead, booked demo, or trial signup. A CPA calculator makes that number easier to check quickly, and it matters because the metric sits much closer to business value than clicks or impressions.
A low CPC does not guarantee efficient acquisition. Cheap traffic can still convert badly. A high CTR does not guarantee profit either. CPA is where traffic cost and conversion quality finally meet. That is why the metric is useful in real decisions: it helps you judge channel efficiency, funnel resilience, and whether acquisition cost still makes sense against revenue, margin, or customer lifetime value.
The safest way to use CPA is alongside the other metrics that explain it. Use CPC to understand click cost, conversion rate to understand funnel efficiency, ROAS to understand immediate revenue performance, and LTV to judge whether a higher CPA is still acceptable over time.
Core formula
Forecast formula
Use CPA to judge acquisition efficiency, CPC to diagnose traffic cost, ROAS to understand immediate revenue, LTV to evaluate long-term economics, and eCPA to compare blended channel performance.
Metric
Metric
Metric
Metric
Metric
| CPA | Cost to win one conversion | Acquisition efficiency | Cost to win one real result | Does not show where inefficiency started |
|---|---|---|---|---|
| CPC | Cost for one click | Traffic buying | Click cost pressure | Cheap clicks can still be low quality |
| eCPA | Effective blended acquisition cost | Portfolio-level reporting | Cross-channel efficiency view | Hides channel-level leaks |
| LTV | Customer value over time | Sustainable scaling | How much CPA the business can absorb | Slower and model-dependent |
| ROAS | Revenue per ad dollar | Immediate monetization | Short-term revenue read | Can miss long-tail value |
These examples help users connect a CPA number to real campaign decisions instead of treating it like a standalone ratio.
Spend $1,200 and generate 24 purchases. Your CPA is $50. If your target CPA is $45, the campaign is close, but not efficient enough to scale safely.
If your CPC is $4.80 and your conversion rate is 2%, your forecast CPA is $240. The problem probably starts with traffic cost or weak message match.
A $60 CPA may still be healthy if average customer value is $240 and payback is acceptable. A cheap CPA is not the same thing as a profitable CPA.
A good CPA depends on what you sell, where you advertise, how quickly you need payback, and whether you optimize for leads or purchases. That is why this section separates channel-level and industry-level planning bands instead of pretending one universal “good CPA” exists.
Last updated: April 2026
Sources: WordStream, Triple Whale, EMARKETER, Search Engine Land
Platform
Platform
Platform
Platform
Platform
US CPA usually looks higher because auctions are denser and AOV expectations are higher. In Europe, compare country by country instead of treating the region as one market.
Consumer acquisition costs usually rise in peak retail periods. Compare Q4 against Q4, not against annual averages.
Meta said on March 10, 2026 that location fees of 2% to 5% will be added from July 1, 2026 in several European markets, which will push effective CPA and CPM higher there.
Source notes
High CPA usually comes from one of four issues: expensive traffic, weak conversion intent, landing page friction, or measurement problems. The fastest fix is usually upstream, not a bigger bid.
Tip 1
When audience filters become too restrictive, the platform has fewer efficient opportunities to spend. Broader targeting plus better creative often lowers CPA faster than extra audience layers.
Tip 2
If the ad promise and landing page promise do not match, conversion rate falls and CPA rises. Tighten message match before changing bids.
Tip 3
Missing, delayed, or duplicated conversion signals can make CPA look worse or better than it really is. Audit measurement before blaming the auction.
Tip 4
Slow pages, weak trust, long forms, and unclear next steps waste paid clicks. If CTR is healthy but CPA is rising, start on the page.
Tip 5
Creative fatigue often shows up as rising CPA before CTR fully collapses. Refresh hooks, angles, and first-second retention assets before performance breaks.
Tip 6
Some accounts push too hard for deep-funnel conversion events before enough signal exists. Sometimes the right move is better optimization staging, not more budget.
Tip 7
A blended CPA can hide device, geo, placement, or daypart leaks. Segment the problem before you call the whole channel bad.
Tip 8
Spend can grow faster than the account’s ability to find efficient new conversions. Watch marginal CPA, not just average CPA.
Most teams do not need another ratio. They need to know whether to keep spending, optimize first, or shift budget to a better channel.
After moving from pixel-only attribution to cleaner conversion tracking, the brand recovered hidden conversions and improved optimization feedback.
22% lower CPA in 30 days
TikTok reported lower CPA for Toyota’s automotive-focused lead generation format compared with its standard setup.
38% lower CPA
SEM restructuring, smarter bidding, and cleaner conversion optimization materially improved acquisition efficiency.
82% lower CPA
Use this as a directional planning chart. 2024 and 2025 use public benchmark releases. 2026 is a planning outlook, not a final platform-issued benchmark dataset.
Hover to compare channels. 2026 points are directional planning estimates rather than official platform-issued final values.
Check whether expensive clicks are pushing CPA up.
Open CPC calculatorSee whether weak engagement is starving the funnel.
Open CTR calculatorFind out whether rising auction pressure is the real problem.
Open CPM tool