Metric
CPA
- You pay for
- Each conversion
- Best for
- Lead generation and revenue-focused campaigns
- Best signal
- Closer to business outcomes than top-of-funnel metrics
- Blind spot
- Can hide reach problems or creative fatigue early in the funnel
Built for paid media teams
Use this CPM calculator to calculate CPM, compare channels, and see whether your number looks normal.
Fill in both campaigns to compare their cost efficiency
Use this to compare with the first campaign
CPM tells you what it costs to buy 1,000 ad impressions. It is one of the fastest ways to compare reach across channels, audiences, or creative formats.
On its own, CPM does not tell you whether a campaign is profitable. It does tell you how hard the auction is. If two campaigns target a similar audience and one has a much higher CPM, the usual reasons are tighter targeting, pricier placements, weaker relevance, or heavier competition.
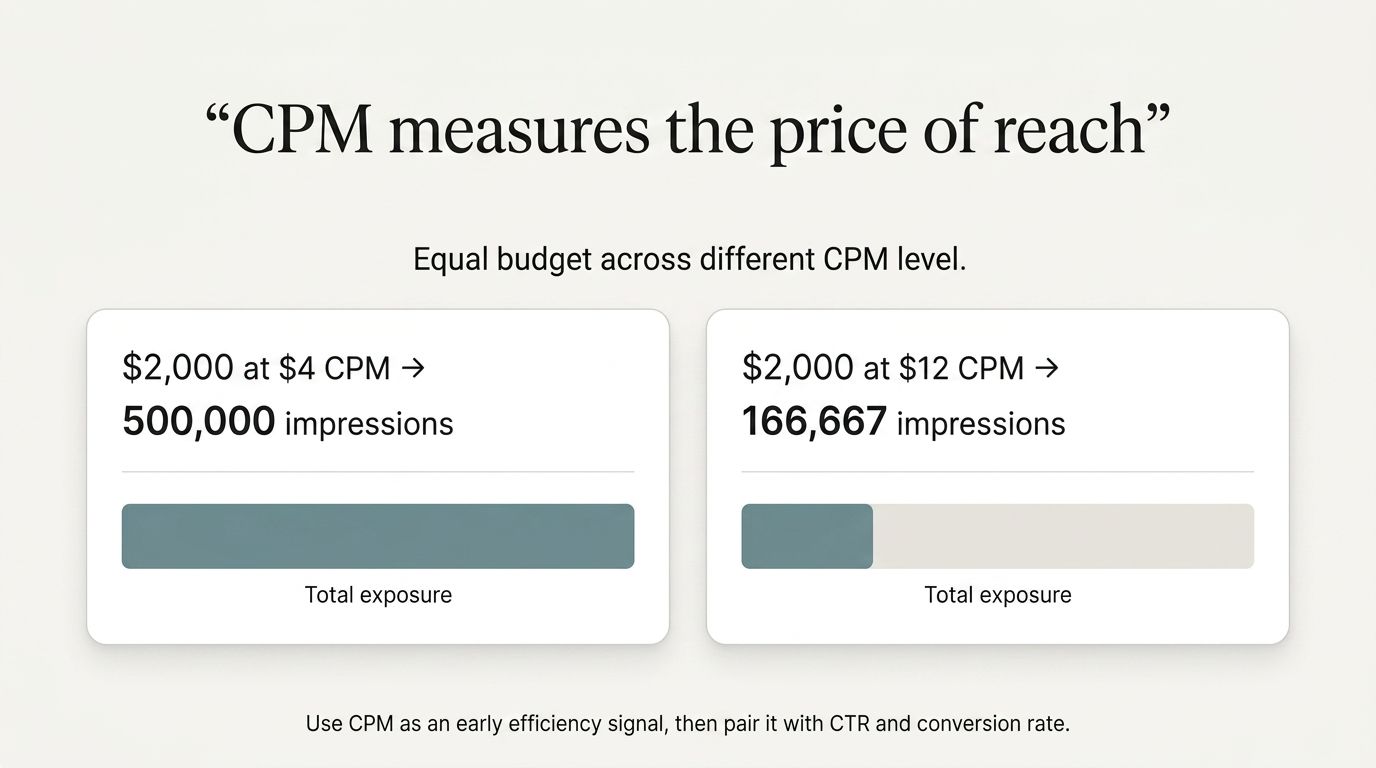
CPM is also useful for planning because it turns budget into reach quickly. At a $4 CPM, a $2,000 budget buys about 500,000 impressions. At a $12 CPM, that same budget buys about 166,667. That difference matters when you are planning awareness, testing creative, or estimating frequency.
The safest way to use CPM is as an early read, not a final answer. Check it alongside CTR, conversion rate, and downstream revenue before deciding whether those impressions were worth the price.
Core formula
Use CPM for reach, CPC for traffic, CPA for outcomes, and eCPM to compare revenue across mixed monetization models.
Metric
Metric
Metric
Metric
| CPA | Each conversion | Lead generation and revenue-focused campaigns | Closer to business outcomes than top-of-funnel metrics | Can hide reach problems or creative fatigue early in the funnel |
|---|---|---|---|---|
| CPC | Each click | Traffic acquisition and landing page testing | Shows how efficiently your ads generate visits | Can look cheap even when post-click quality is weak |
| CPM | 1,000 impressions | Brand awareness, reach, frequency planning | Fast way to compare attention cost across channels | Does not tell you whether impressions turned into traffic or revenue |
| eCPM | Normalized revenue or yield per 1,000 impressions | Comparing monetization efficiency across formats or partners | Useful when revenue is generated through mixed pricing models | Less intuitive for advertisers focused on buying media instead of monetizing inventory |
These are quick planning checks, not promises. They help because CPM turns budget into a rough reach estimate before you get pulled into platform detail.
$500
At a $5 CPM, that budget buys about 100,000 impressions. At a $10 CPM, it buys about 50,000. Sometimes a campaign feels like it did not scale when the real change was simply a more expensive auction.
When CPM doubles, reach gets cut in half.
$2,000
Use CPM to sense-check channel mix early. A $4.50 display CPM buys broad reach. A $14 Meta CPM can still be worth it if it reaches a more valuable audience or drives stronger engagement.
Cheap reach and expensive reach are not the same thing as good and bad.
$10,000
At larger budgets, CPM gaps matter quickly. A blended plan at $7 CPM delivers about 1.43M impressions. A blended plan at $11 CPM delivers about 909K. That changes how much room you have for reach, frequency, and creative testing.
A few dollars of CPM change can mean a lot of lost reach.
If you are trying to work out what a good CPM looks like, treat these CPM benchmarks as planning baselines, not guarantees. They are most useful when you compare like with like: the same region, objective, creative maturity, and funnel stage.
Last updated: April 2026
Data compiled from 2025-2026 public benchmark reports, including Affect Group, Store Growers, Stackmatix, ZenABM / Valueships, and display advertising cost analyses.
| Quick read | Your status | |||
|---|---|---|---|---|
| Google Display Network | $2.80-$6.50 | $4.55 | Usually the cheapest way to buy broad reach. Costs jump when you layer narrow audiences, premium inventory, or heavy remarketing. | Enter a CPM to compare. |
| TikTok | $4.50-$12.00 | $8.00 | Awareness campaigns can stay near the floor. Traffic and conversion objectives climb quickly if creative stops looking native to the feed. | Enter a CPM to compare. |
| YouTube | $5.00-$14.00 | $9.29 | Standard video formats often cluster near the middle of the range. US campaigns and higher-intent video objectives usually push above the global average. | Enter a CPM to compare. |
| Meta (Facebook + Instagram) | $8.00-$23.00 | $14.50 | US campaigns often sit at the high end. Affect Group’s 1Q 2026 US ranges place reach objectives materially lower than sales or lead-gen objectives. | Enter a CPM to compare. |
| $15.00-$44.00 | $33.80 | Standard B2B targeting is usually the most expensive of the major self-serve channels. Thought Leader Ads and looser awareness buys can come in far lower. | Enter a CPM to compare. |
Usually benefits from broader creative volume and larger audiences, so CPM often stays below B2B categories unless Q4 demand is compressing supply.
| Platform | Typical CPM band | What usually pushes it there |
|---|---|---|
| Google Display Network | $2.80–$5.20 | Good for prospecting and remarketing when catalog traffic is broad. |
| Meta | $8.00–$16.00 | Creative freshness matters more than minor targeting tweaks. |
| TikTok | $5.00–$9.00 | UGC-style creative often keeps CPM below mature paid social norms. |
| YouTube | $8.50–$14.00 | Higher spend makes sense when creative can educate before the click. |
Holiday and year-end budget pressure usually pushes CPM up by roughly 20% to 50%, especially from late October through December.
US auctions tend to clear higher because advertiser competition is denser. EU campaigns often buy cheaper reach, but results vary a lot by vertical and market maturity.
Smaller addressable audiences, stricter geo filters, and premium placements usually push campaigns toward the expensive edge of every benchmark band.
Source notes
Start with the structural causes before you blame the algorithm. Most high-CPM problems come from audience shape, creative fatigue, placement mix, or a mismatch between the campaign goal and what the platform is optimizing for.
High CPM often starts with audience design. If you stack narrow geo filters, layered interests, and small lookalikes, the platform has to compete for a very small pool of inventory. That pushes costs up before the creative even has a chance to help. Start by removing overlapping targeting layers and checking for audience overlap between ad sets.
These examples are intentionally small and practical. The point is to show what changed, what happened to CPM, and what that change may mean in your own campaigns.
US creator marketplace on Meta
Blinker tightened the audience strategy and rebuilt the creative around the creator segment instead of buying broad social-interest traffic.
34% lower CPM
The important point is that lower CPM did not come at the expense of quality. Acquisition costs also fell 48%, which suggests the cheaper impressions were still commercially useful.
Blinker x Threadless case studyEU sports nutrition brand on TikTok
The team reused organic winners, rotated creative more often, and leaned harder into native TikTok video instead of polished brand creative.
61% lower CPM
This is a good reminder that on TikTok, creative that feels native to the feed can move CPM faster than budget changes.
believe.digital TikTok case studyB2B SaaS campaign on LinkedIn
The team ran multiple formats side by side, and the Thought Leader version was far cheaper to distribute than the image ads.
95% lower CPM than image ads
On LinkedIn, format choice can matter as much as targeting. Different ad types do not get priced the same way.
ZenABM / Valueships case studyThe shape matters more than the exact number: a cheaper start to the year, a summer dip in some channels, and a clear Q4 premium almost everywhere.
This is a directional CPM index built from the benchmark sources above. Use it to see the shape of the year, not as a platform-issued raw spend dataset.
Hover or tap a series to focus it. Index base is normalized rather than raw CPM so different platforms can be compared on the same chart.
CPM is the cost of buying 1,000 impressions. Advertisers use it to understand how expensive it is to get their ads seen.
The term "mille" comes from Latin and means thousand, so CPM literally means cost per thousand.
This pricing model is widely used in:
Unlike click-based or conversion-based pricing, CPM focuses on exposure. It is most useful when the main question is how much reach your budget can buy.
Marketers usually lean on CPM when they are planning awareness campaigns, comparing media costs, or checking whether one audience or channel is getting unusually expensive.
To calculate CPM, divide total cost by impressions, then multiply by 1,000.
The formula is: CPM = (Total Cost ÷ Ad Impressions) × 1,000If you spend $500 on a campaign that generates 100,000 impressions, your CPM is ($500 ÷ 100,000) × 1,000 = $5.
This gives you a simple way to compare reach costs across campaigns, even when total spend and impression volume are very different.
A CPM calculator saves time when you want to compare multiple scenarios or back into budget and impression targets.
A good CPM depends on the platform, audience, market, and campaign goal. If you use a CPM calculator, these ranges are a useful starting point for judging whether your number looks normal. They are broad benchmarks, not hard rules:
Industry Benchmarks:
B2B campaigns often run higher CPMs than broad B2C campaigns because the audiences are smaller and more competitive.
The best comparison is usually your own history: same platform, same objective, similar audience, similar season.
A bad CPM is usually one that sits well above the normal range for your platform or your own historical baseline without producing better results.
Warning Signs by Platform:
Common Causes of Bad CPM:
If CPM jumps and nothing downstream improves, compare the campaign against a similar time period, audience, and objective before drawing conclusions.
In practice, the fix is usually better audience design, fresher creative, cleaner placement control, or a more realistic campaign objective.
It depends on whose side you are on. Advertisers and publishers want opposite things from CPM.
For Advertisers: Lower CPM Is Usually Better
If you are buying media, a lower CPM means you are paying less to reach 1,000 people.
If your budget is $1,000, a $5 CPM buys 200,000 impressions, while a $10 CPM buys 100,000 impressions.
That said, the cheapest CPM is not always the best one. A higher CPM can still be worth it if the audience is better or the traffic converts better.
For Publishers: Higher CPM Is Usually Better
If you are selling ad inventory, a higher CPM means more revenue for the same impression volume.
With 1 million impressions, a $10 CPM generates $10,000 in revenue, while a $5 CPM generates $5,000.
But there is still a tradeoff. If rates go too high, buyers may spend elsewhere and total revenue can fall.
So the better CPM depends on your role. Buyers usually want lower costs. Sellers usually want higher rates. In both cases, the useful question is whether the price still makes sense for the quality you are getting.
Do not judge CPM in isolation. Look at audience quality, campaign goal, and what happens after the impression.